
Tropical Cold-Point Tropopause (CPT) Hovmoeller Diagnostic#
Overview#
This recipe evaluates the structure of the tropical (20°S-20°N) cold-point tropopause (CPT) using Hovmoeller-style plots. The CPT is defined, at each grid point and time step, as the pressure level of minimum temperature between 500 hPa and 10 hPa. For each dataset, the diagnostic produces one standalone figure per variable, in two views:
longitude-time (mean over the tropical latitude band, full longitude range)
latitude-time (restricted to the tropical latitude band, mean over the full longitude range)
In both views, filled colors always show CPT pressure, and line contours show one of CPT temperature, CPT specific humidity, or CPT relative humidity over ice (computed from CPT temperature, specific humidity and pressure).
Available recipes and diagnostics#
Recipes are stored in recipes/
recipe_tropical_cpt_hovmoeller.yml
Diagnostics are stored in diag_scripts/tropopause/
Variables#
ta (atmos, monthly mean, longitude latitude level time)
hus (atmos, monthly mean, longitude latitude level time)
An optional geopotential height variable (zg) is also read, if present
in the input data, to additionally save the CPT geopotential height; it is
not required and is not plotted.
Observations and reformat scripts#
ERA5 (native6 project, tier 3)
Any other model or observational dataset providing ta and hus on
pressure or model levels can be used in place of, or in addition to, the
datasets configured in the example recipe.
Example plots#
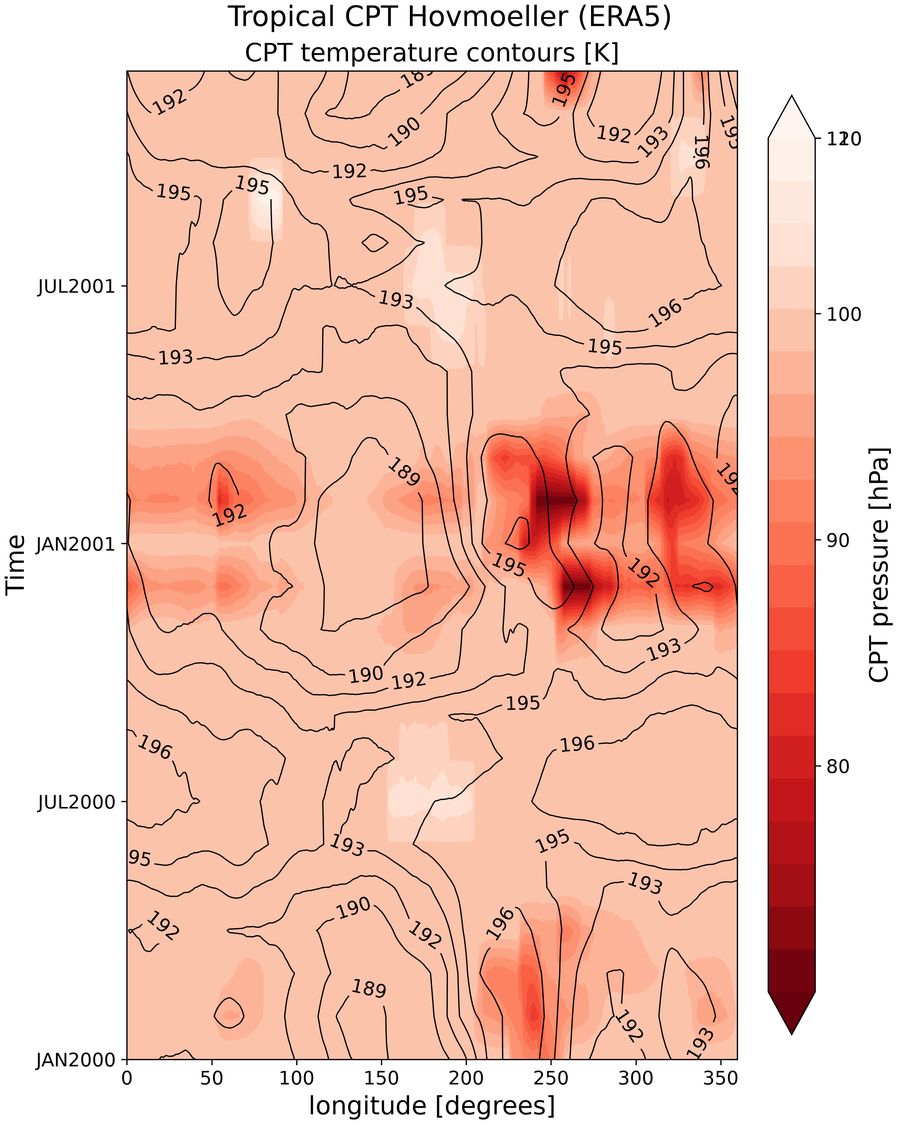
Fig. 211 Tropical CPT longitude-time Hovmoeller for ERA5: colors show CPT pressure, contours show CPT temperature.#
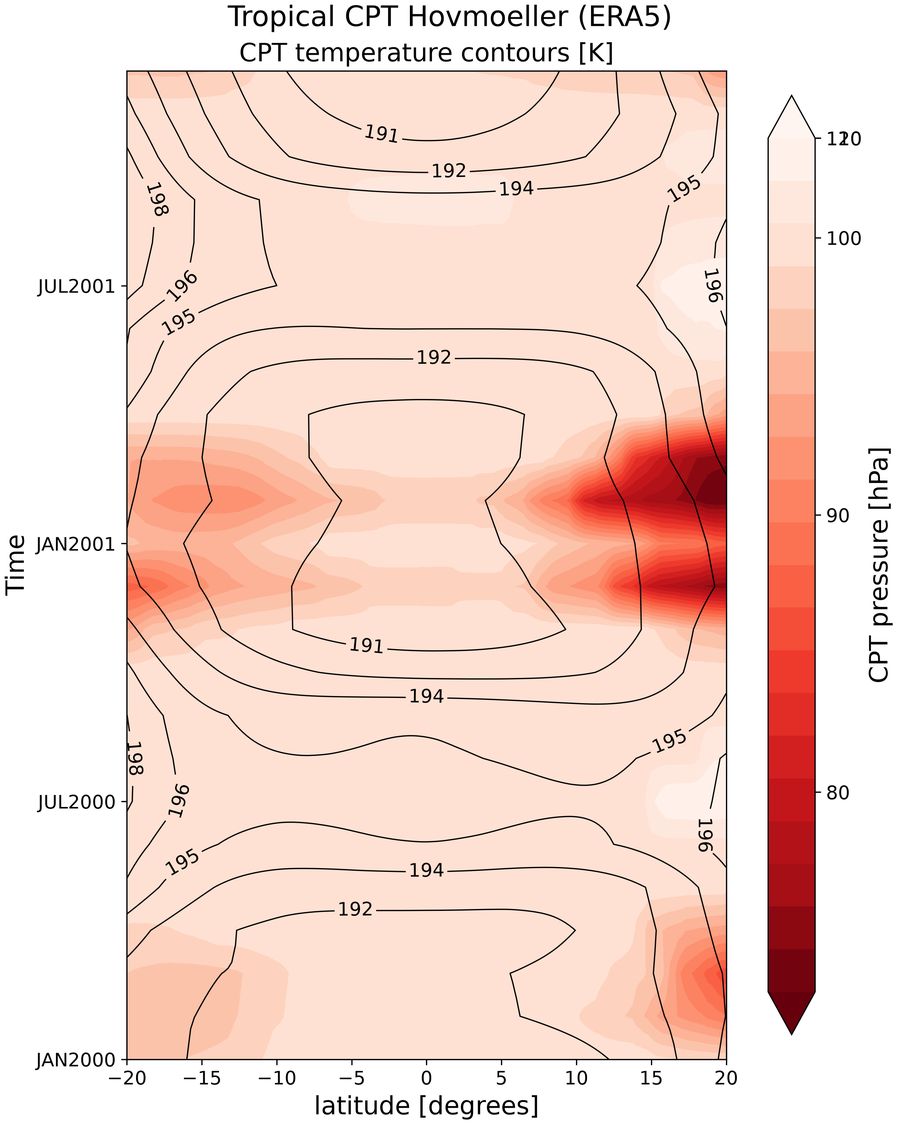
Fig. 212 Tropical CPT latitude-time Hovmoeller for ERA5: colors show CPT pressure, contours show CPT temperature.#